To report an outage, call
1-800-448-2383
Home Energy Report FAQ
What does a Home Energy Report look like?


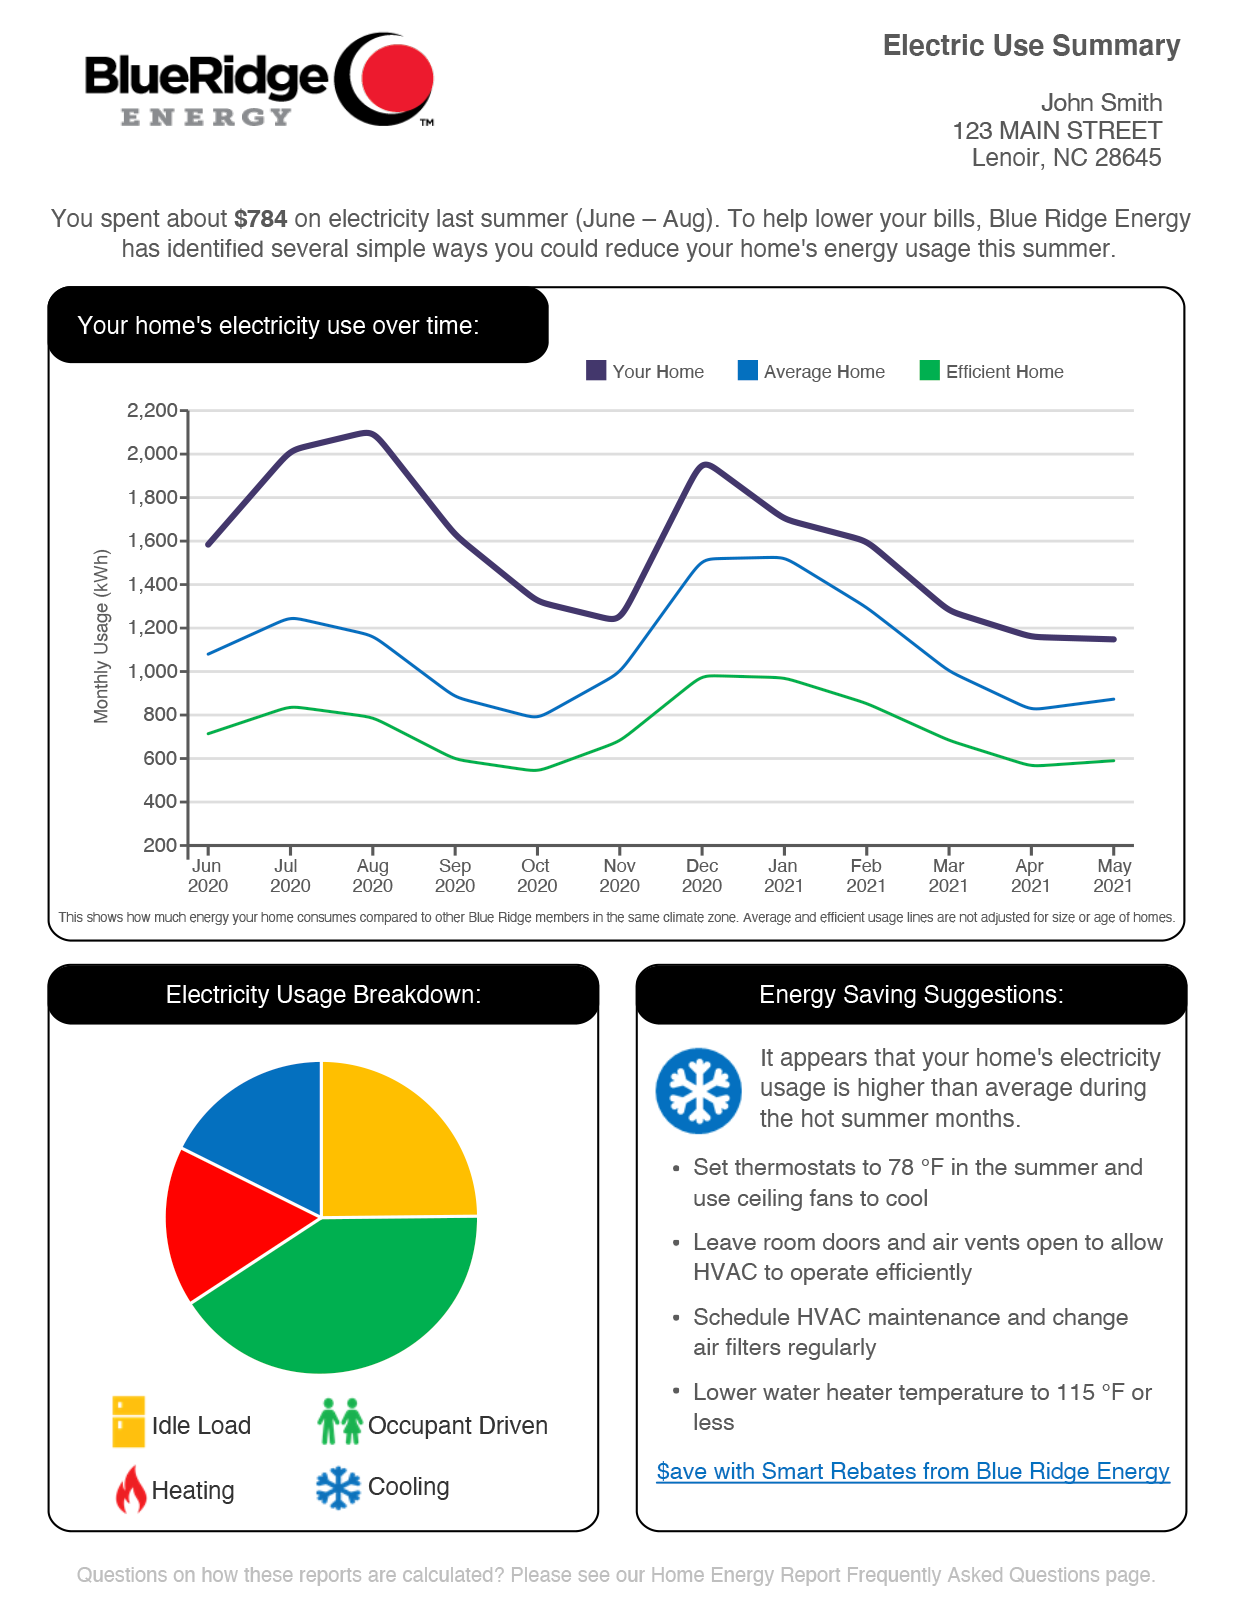
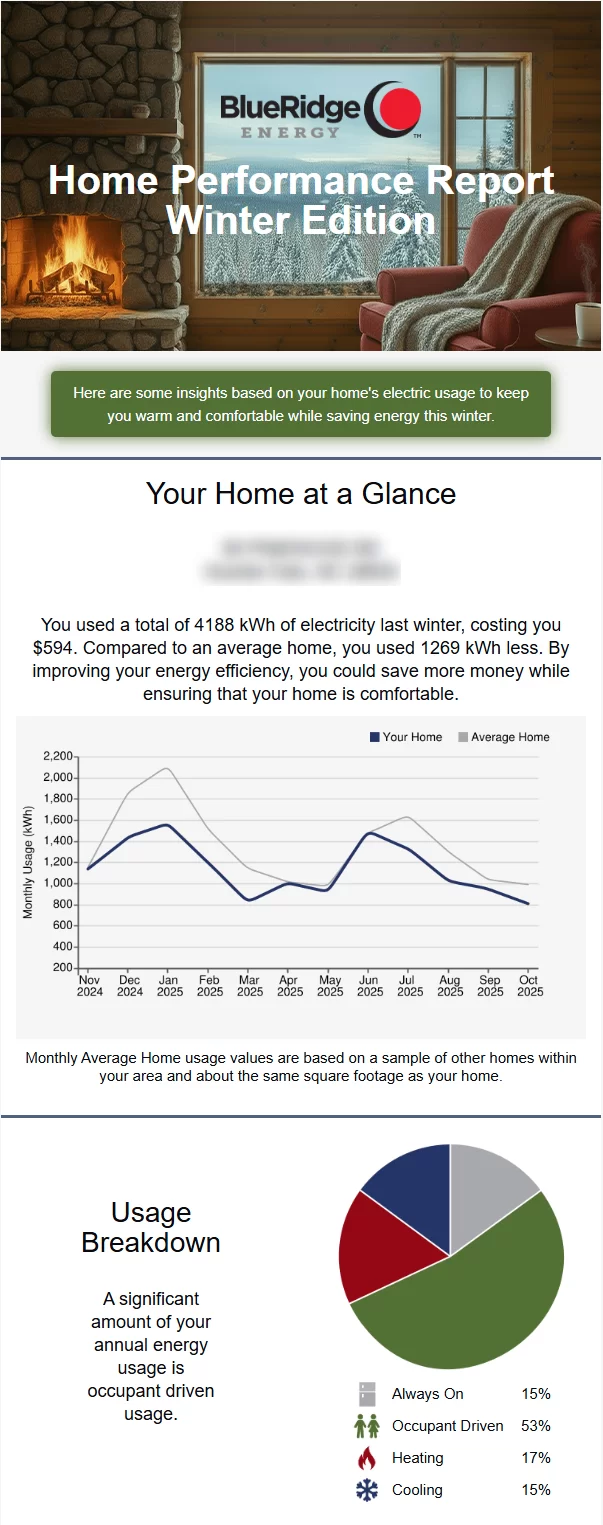
This is a sample of what a home energy report will look like. Homes are divided based upon ZIP code into three climate zones: piedmont, foothills and mountains. Each zone has a different calculation for average and efficient usage. For a given month all usage on Residential rates above a minimum usage threshold (100 kWh) are collected. “Average Usage” is the median value (50th percentile) and “Efficient Usage” is the 25th percentile. The average and efficient usage lines do not consider your home’s square footage, age or number of occupants.
Suggestions are tailored to fit your unique usage profile. Members with a high summer cooling energy usage or load will receive recommendations focused on improving HVAC performance via best practices and system maintenance. Members with high occupant driven energy usage (load) will receive recommendations focused on changes to equipment and behavior that should reduce their energy usage (load).
FAQ
The Electricity Usage Breakdown Pie Chart is based on your home’s electric use during the last 12 months.
![]()
Home idle load is the energy used by appliances that are always on. Devices that contribute to idle load include refrigerators and freezers, electric water heaters, telephones, clocks, smoke alarms, and plugged-in electronics such as televisions, cable boxes, and game consoles.
![]()
Occupant driven load is the energy used by the occupants of a home day-to-day that is not seasonally dependent. Examples of occupant driven loads are lights, kitchen appliances, vacuums, electronics, and power tools.
![]()
Home heating and cooling loads are the energy required to maintain a home's indoor temperature. Heating and cooling loads are calculated by comparing a home's electricity usage to outdoor temperature from the closest airport weather station. Note that seasonal energy usage can appear to be heating and cooling loads. For example, during the winter months the electricity used for hot water and clothes washing tends to be greater, and during the summer months the electricity used for refrigerators and pool pumps tends to be greater.
(Always operating): Refrigerator, Chest Freezer, Water Heater, Pool Pumps, Aquarium, Security System, Well Pump
Dishwasher, Laundry, Electric Oven, Lights, TV, Computer, Video Game Consoles


